The best infographic sites today fall into two groups. Some are places to find great examples and data worth visualising, like Cool Infographics, Visual Capitalist, Statista and FlowingData. Others are infographic submission sites that will publish your work, like Infographic Site, Infographic Journal, Infographic Plaza and InfographicBee. I checked every site on this list on 19 November 2026 to make sure it’s still live and still publishes or accepts infographics, and I’ve dropped the ones that have closed or stopped.
That check matters, because most lists online are copied from older lists. Plenty of the entries on them now show an error, a parked domain or a shop selling something else entirely.
Top infographic sites list at a glance
| Name | What it is | Takes submissions? | Best for |
|---|---|---|---|
| Infographic Site | Reviewed infographics with written articles | Yes, paid review | A permanent, credited page for your work |
| Cool Infographics | Curated data visualisation site | Yes, free, curated | Inspiration and high-quality design |
| Visual Capitalist and Voronoi | Data-led charts and a creator platform | Voronoi only, free to apply | Brands with original data |
| Statista | Daily charts from its own data | No | Finding data and ideas |
| FlowingData | Visualisation blog and tutorials | No | Learning what good looks like |
| Information is Beautiful | Independent design studio | No | Creative inspiration |
| Infographic Journal | Large archive | Yes, free and paid | Reach across many categories |
| Infographic Plaza | Showcase with social sharing | Yes, free | A free listing |
| InfographicBee | Gallery of studies and surveys | Yes, free and paid | Survey and research results |
| Visualistan | Infographics plus tech and social media news | Yes, paid only | Quick publishing |
| Infographics Archive | Directory | Yes, free and paid | Patient marketers, it posts less often |
| Pinterest, SlideShare, Reddit | Platforms you post to yourself | Yes, free | Sharing with an existing audience |
Where to discover creative infographic examples and data
If you want to see what good work looks like, or find data to build your own around, start here. None of these are submission sites in the usual sense, but they’re the best places to learn from before you brief a designer.
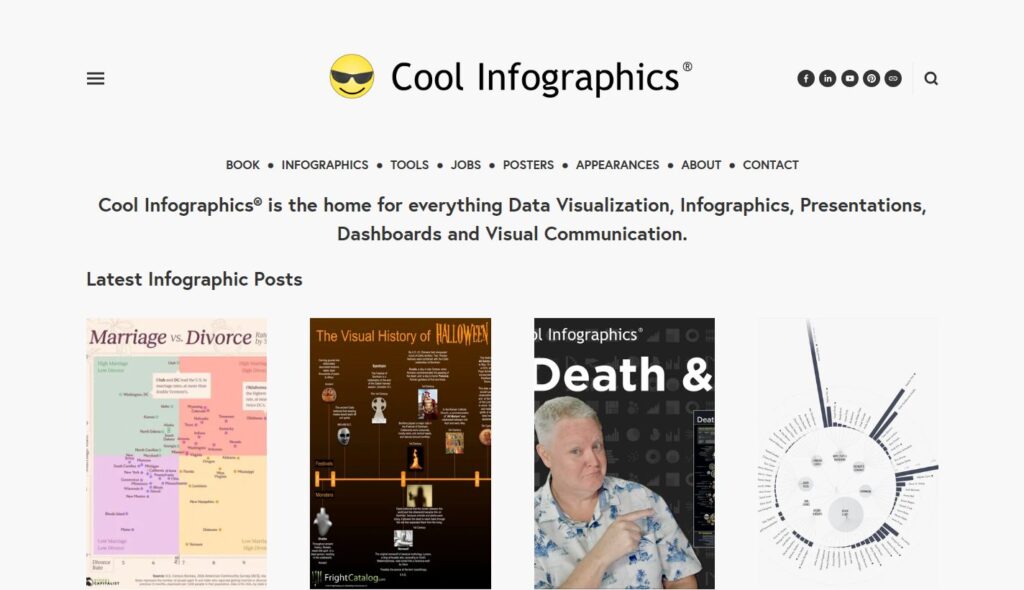
Cool Infographics
Cool Infographics is a long-running, curated publication about data visualisation and design, with new posts as recently as November 2026. It’s free to submit, but only by sending a link to where your piece is already published online, and the editor decides what gets featured. That makes it hard to get onto and worth the effort, because only strong, visually appealing work appears.
Visual Capitalist and Voronoi
Visual Capitalist publishes data-led charts on markets, economics and technology every week. It doesn’t take outside submissions, but its sister platform Voronoi does. Anyone can apply free by sending in a first data story, and approved accounts can then publish to the app. It’s best for brands with genuinely interesting data of their own.
Statista
Statista’s infographics are simple, sourced charts built from its own data, with several new ones most days. You can’t submit to it, but it’s one of the quickest ways to find a number worth visualising, and a good model of how to keep a chart clear.
FlowingData and Information is Beautiful
FlowingData posts data visualisation examples and commentary most days, with tutorials for members. Information is Beautiful is an independent studio that makes its own infographics and data visuals, and it has recently brought back its Beautiful News project. Neither takes submissions. Both are a valuable source of creative ideas.
Infographic submission sites that still publish
These are the places that take infographic submissions today, so they belong on any infographic submission sites list. Each one was live and had published new work recently when I checked, and each will help your infographic reach a wider audience.
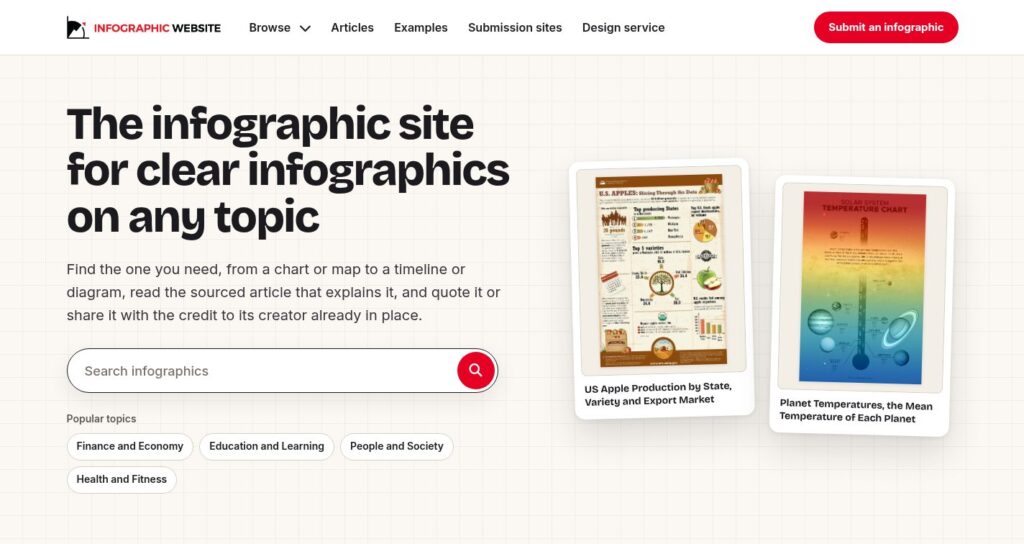
Infographic Site
Infographic Site publishes reviewed infographics on almost any topic, each with a written article that explains it, and new ones go up regularly. When you submit, you get a permanent page in the right topic with a clear credit and a link to your site, your data written out so readers can quote them, and embed code so others can share it with your credit in place. Submission is a paid, one-off review, and it aims to review within 48 hours. It’s best for marketing teams and agencies that want a lasting, credited page rather than a short-lived post.
Infographic Journal
Infographic Journal is a large archive (it lists over 12,100 infographics) that still publishes new ones every week. Basic submission is free but goes into a queue, which it says can take two to three weeks. Paid options publish faster or feature you on the home page.

Infographic Plaza
Infographic Plaza has published around 4,000 infographics over 11 years and was still posting new ones in November 2026. Submission is free, and it promotes what it publishes on its social media channels.
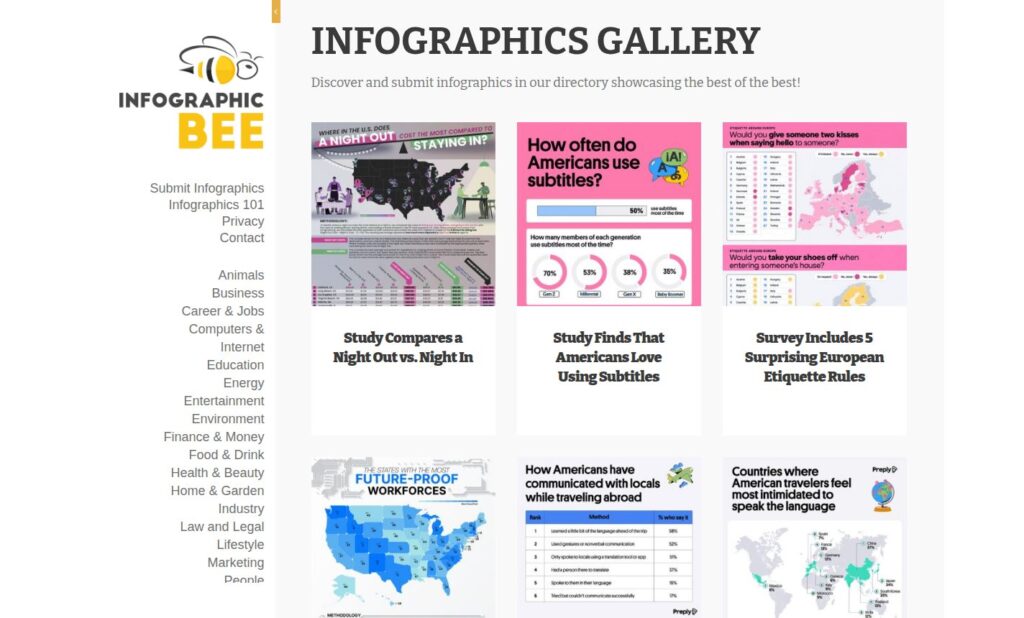
InfographicBee
InfographicBee is a gallery that leans towards data studies and survey infographics, with new posts every week. You can submit free, though it says review can take several weeks, or pay for an express review within a few business days that also shares your work on its social media. Not every submission is accepted.
Visualistan
Visualistan mixes infographics with tech and social media news and was posting in October 2026. It’s paid only, with a faster option if you need it live within a day.
Infographics Archive
Infographics Archive still takes submissions, with a free option and paid tiers that publish faster and add social media promotion. It posts far less often than it used to, with its most recent posts from early 2026, so treat the free route as a long wait.
Social media sites for infographic sharing
These aren’t infographic directories, but they’re where a lot of sharing happens online, and they let you reach people directly. On Pinterest, tall images suit the format and each Pin can link back to your page. SlideShare, now part of Scribd, still takes PDF uploads, which suits an infographic turned into a short slide deck. On Reddit, communities such as r/dataisbeautiful and r/Infographics take original work, but check each community’s rules before posting. And don’t forget LinkedIn, where a clear chart from your own research is often the post that gets the most attention.
Sites we removed, and why
The older version of this page included entries that no longer do the job.
- Daily Infographic. The domain redirects to a packaging company.
- Infographics Showcase. The domain no longer resolves.
- Mashable. Still a news site, but its submission page returns an error and it doesn’t take infographic submissions.
- Gifographics. Its blog hasn’t published new work since 2021.
- Revuwire. It accepts infographics by email, but its infographic section hasn’t had new posts in years.
- Visual.ly. It sits behind a bot check, and I couldn’t confirm that its community gallery still publishes new work.
Do infographic submission sites still boost SEO and attract links?
For exposure, yes, if you pick relevant ones. For links, be careful. Google’s spam policies treat links you pay for as link spam unless they’re marked nofollow or sponsored. That means a paid listing should be judged on the audience and the permanent, credited page it gives you, not on the backlink.
The infographics that attract real links are the ones built on original data that journalists and writers want to cite. That’s the essential part of any effective link strategy. Publish yours on your own site first, with the key data written out in text so search engines and AI answers can read it. Then share it with the people who’d care, such as industry publications, partners and your email list. Our guide to backlinks explains why relevance beats volume, and our link building work starts from the same principle.
How to promote your infographics, a simple infographic marketing strategy
- Host it on your own site first. Every listing should point back to your original page, not to the image file.
- Write the data out. Put the key numbers and their sources in the text around the image so people can quote them.
- Offer embed code. It makes it easier for others to share your work with a credit and a link.
- Keep the file size sensible. Long infographics can be heavy, so compress them before upload. Our guide on why image size matters shows how.
- Use the channels you already have. Your email list, LinkedIn and partners usually engage more people, and lead to more enquiries, than a dozen directory listings. Our guide on how to promote your blog covers this.
Which free infographic tool should you use? Canva, Piktochart and more
You don’t need a designer to make a simple, clear infographic. Canva, Piktochart, Venngage and Infogram all offer free plans with free infographic templates. Infogram is the best tool for interactive charts and graphs, while Canva and Piktochart are the quickest tools for a one-off design. Easel.ly, which older lists still mention, has since become a design service for signs and print. Keep it to one story, two or three colours and a font that’s easy to read on a phone, and always credit your data sources.
Common questions about infographic sites
Where can I submit infographics for free?
Infographic Plaza takes free submissions, and Infographic Journal, InfographicBee and Infographics Archive all have free options with a longer wait. Cool Infographics is free but curated. Pinterest, SlideShare and Reddit are free platforms you post to yourself.
What is the best infographic website for inspiration?
Cool Infographics, Visual Capitalist, FlowingData and Information is Beautiful consistently publish some of the best data visualisation online. Statista is the best for simple, well-sourced charts.
Do infographics still help SEO?
They can, when they’re built on original, useful data and hosted on your own site. A good one gives other sites a reason to link to you. A generic one spread across a dozen directories usually doesn’t, and it won’t do much for your digital marketing either.
Make your own site the best home for your infographics
Wherever you send it, the original should live on your own website first, on a fast page that search engines can read. If you’d like to know how your site measures up, our free website audit checks speed, SEO, tracking and security and tells you what to fix first.